
Quantifying Manufacturing Losses with Enterprise OEE
Quantifying Manufacturing Production Losses with Enterprise OEE Data
Overall Equipment Effectiveness (OEE) is a method of quantifying production losses due to availability, performance, and quality, measuring manufacturing productivity. By quantifying productivity with OEE and categorizing underlying losses, manufacturing plants gain the insight necessary to prioritize improvement projects, address common production losses, and measure the financial impact of improvements.
OEE metrics are tracked in every major manufacturing industry, including pharmaceutical, oil and gas, materials and mining, and consumer products, and these metrics are particularly popular with process manufacturing organizations. For this reason, automation companies, process historian vendors, software companies, and homebrew Excel spreadsheet template makers have entered their unique takes on a best solution. Despite the many entries, most fail to completely solve manufacturers’ problems.
While the exact implementation varies by vendor, most OEE solutions are site-based with limited database connectivity, or they require installation of specific sensors, prohibiting an organization’s ability to compare OEE metrics among different lines and sites. Additionally, OEE solutions often provide only a limited palette of pre-configured calculations and visualizations, hindering organizations from customizing the ways they measure and visualize OEE, and associated loss categorization. But Seeq addresses these and other challenges.
Why use Seeq for OEE?
Seeq provides distinct advantages over other available OEE solutions, including a user’s ability to:
- Connect to existing data in historians, MESs, LIMS, etc. without the need to install new sensors, execute costly infrastructure projects, or risk data integrity by duplicating data in other systems.
- Compare metrics among multiple sites around the world simultaneously, regardless of differences in data infrastructure.
- Leverage data, including process signals and alarms, to automatically capture downtime events and assign reason codes based on alarms or deviations. This helps to identify causes for micro-stoppage events, and minimize their impacts on operations.
- Enter information, such as downtime codes, using smartphones, tablets, or computers via Seeq’s browser-based interface.
- Customize formulas for OEE and other key performance indicators (KPIs). Using the standard Availability x Performance x Quality formula for OEE, end-users can customize it to fit their organization’s needs, or combine it with other production KPIs to create a holistic view of manufacturing efficiency.
- Identify and act on improvement opportunities using the advanced analytics application on top of OEE data. Improvement opportunities may include projects for predictive maintenance, cycle time reduction, quality optimization, or anomaly detection.
- Leverage data availability for other applications such as business intelligences (BI) tools for management, or machine learning algorithms for data scientists.
Seeq is the most flexible and customizable application for quantifying manufacturing losses with OEE on an enterprise level, and manufacturing efficiency improvement does not stop here, but continues with self-service analytics.
A Sneak Peek at the Seeq OEE Solution
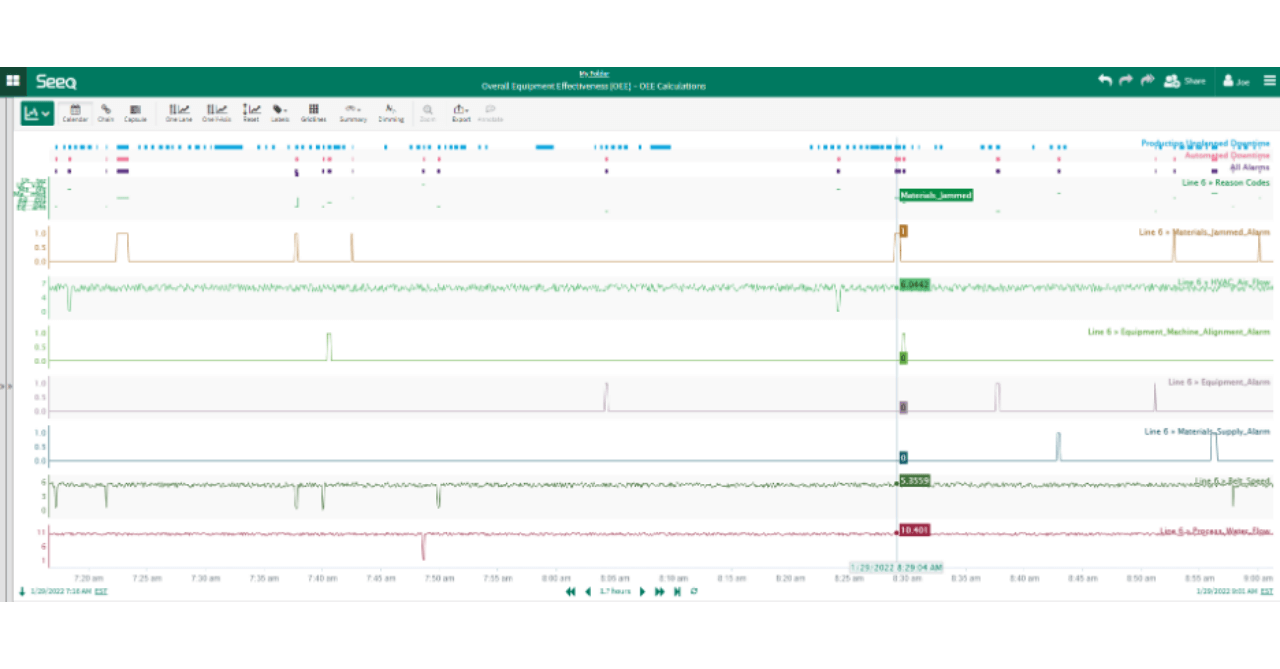
Seeq’s OEE solution starts by automatically identifying unplanned downtime events using logic crafted by a subject matter expert. This can include comparing batch steps to the lowest repeatable time, or leveraging process signals to determine line or plant stoppages. To alleviate operators from the burden of manually assigning reason codes to every unplanned downtime event, the solution can be configured to automatically assign these codes when process deviations or alarms immediately precede unplanned downtime events.
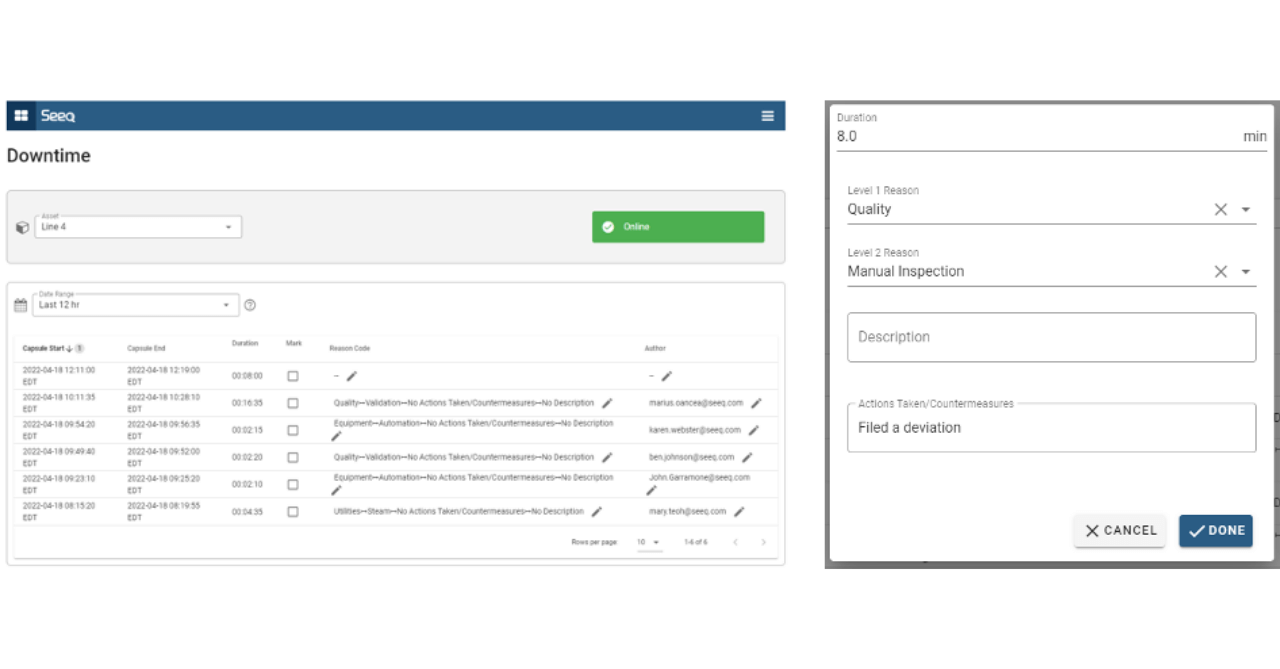
While the goal is to automate the categorization of all downtime causes, there will inevitably be some events that cannot be automated. For these, users can categorize and assign reasons using the Manual Input Tool, designed specifically for operator simplicity and ease of use on tablets or computers.
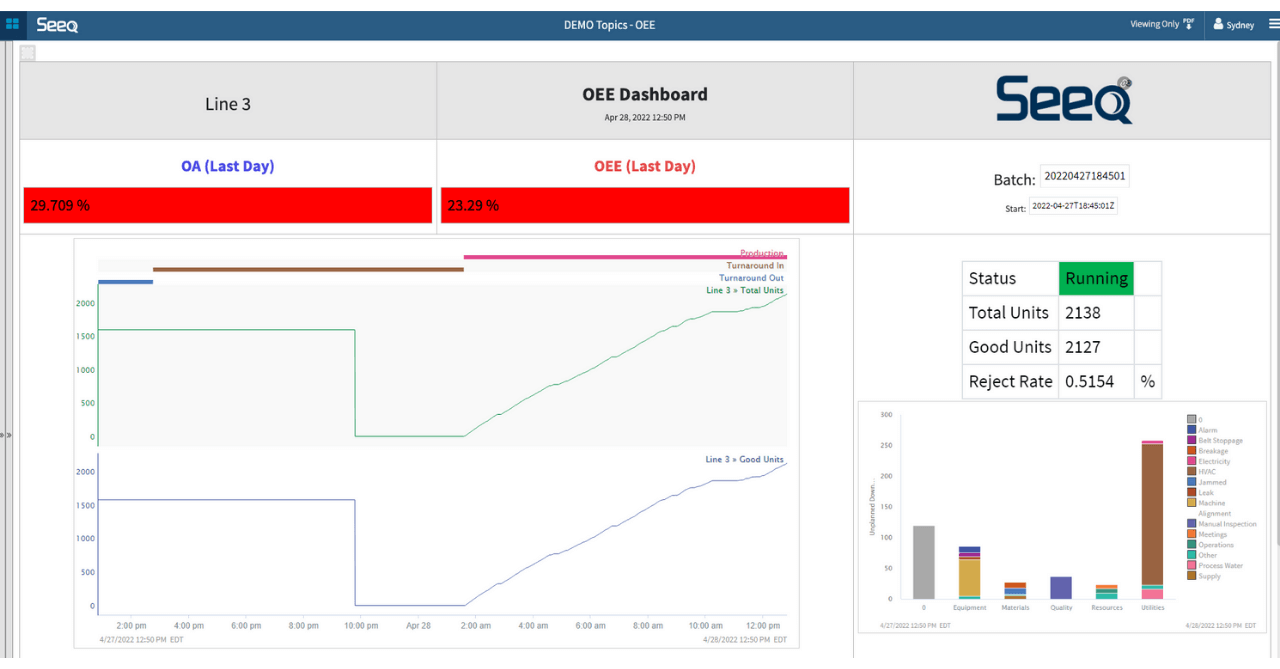
OEE and other KPIs, like operational availability, can be calculated using unplanned downtime events combined with performance and quality losses, customizable by an organization. And the status of manufacturing lines, OEE metrics, breakdown of losses, and other relevant information can be combined into a real-time dashboard view in Seeq Organizer (example below). This flexible dashboard empowers organizations to highlight the most important information in their processes.
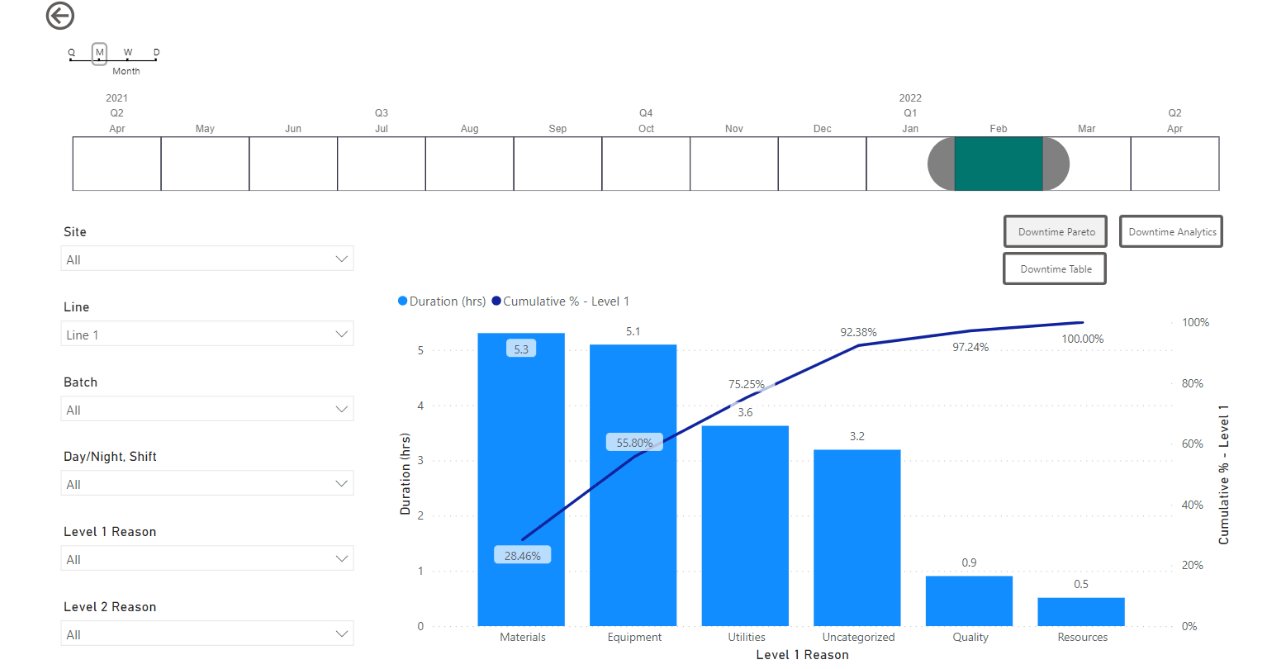
This data can also be streamed via OData to a BI application of choice, such as Microsoft PowerBI, to build displays for business users, enable interactive slicing and dicing of data, and provide standard views for comparison among sites.
Get Started
Interested in the OEE solution? Contact your Seeq Sales Executive or Customer Success Manager for a demo of the solution today.