
Operationalizing Engineering Statistics: Why Apply Statistical Analysis in Process Control?
Statistical analysis empowers process manufacturers to spend less time preparing data and more time acting on the right issues.
Many process manufacturers today are fixing their gaze on two modern focal points—overall equipment effectiveness (OEE) and sustainability. OEE is driven by improved reliability, quality, and production yield, and sustainability is driven by efficient supply chains, minimal energy usage, and reduced emissions. While improving each of these key metrics requires time and effort, advanced analytics tools involving statistics, process control, and monitoring—collectively referred to as statistical analysis—make this more achievable.
Statistical analysis enables teams to standardize their approach to data and decision-making by detecting anomalies early and often to minimize waste and limit the cost of poor production quality. These tools can also identify ideal operating ranges to maximize yield and reduce raw material and energy usage.
When applied properly, statistical analysis empowers manufacturing teams to spend less time preparing data and more time acting on the right issues, helping meet production and sustainability goals. In a recent webinar, we discussed four methods for operationalizing engineering statistics using Seeq, which are summarized below.
1. Build Statistical Process Control (SPC) Charts
The greatest challenge organizations encounter when creating SPC charts is implementing automatic updates across numerous product operations. Whether this entails multiple modes of operations or multiple product types, the calculation of statistical boundaries is highly variable, making the segmenting, or “slicing-and-dicing,” of data a headache for data analysts and process experts.
Seeq simplifies this process by empowering users to perform these calculations using its live data source connectivity. SPC charts are created in a dynamic fashion, with the ability to add context, segment data sets, apply correct limits to correct operating modes, and create aggregated signals for monitoring control parameters.
As a best practice, users should check for normalcy amongst the data prior to creating charts. Seeq’s histogram tool provides data visualization, making it easy to check the frequency of distribution for sample values. With different modes of operation, users can leverage capsules to embed the grade code context into the histogram to gain a better understanding of its distribution.
Once normalcy is verified amongst the data set, users can begin calculating statistical boundaries based on periods when the process is in-control. One way to do this is by specifying in-control time periods and using that data to calculate the averages and standard deviations.
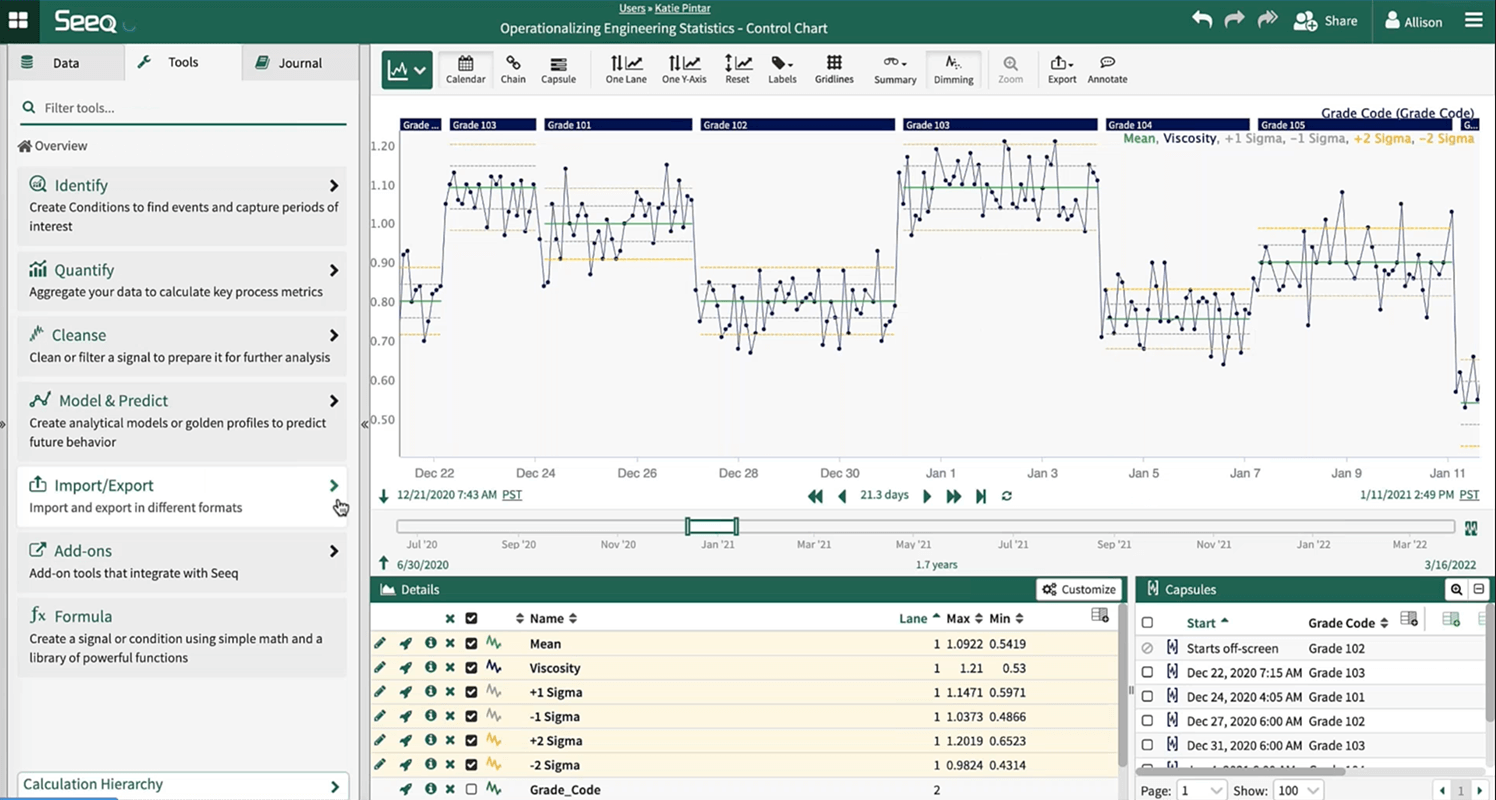
Leveraging these calculations, users can create control limits using Seeq Formula, and deploy them in near-real time to monitor current process performance.
2. Create Run Rules & Identify Violations
The next step is operationalizing SPC run rules, which can identify anomalies and alert teams when data is outside of control limits. This provides production teams with a method for interpreting near real-time data in a uniform way.
The best way to create run rules is with the User Defined Formula Functions Editor Add-on in Seeq. This Add-on enables users to create custom formulas so they can scale run rules more easily across product operations, and create better uniformity in decision-making processes.
Add-on tools can be found in the Seeq Add-on Gallery for use in Seeq Workbench and Seeq Data Lab, with installation instructions and user guides also available.
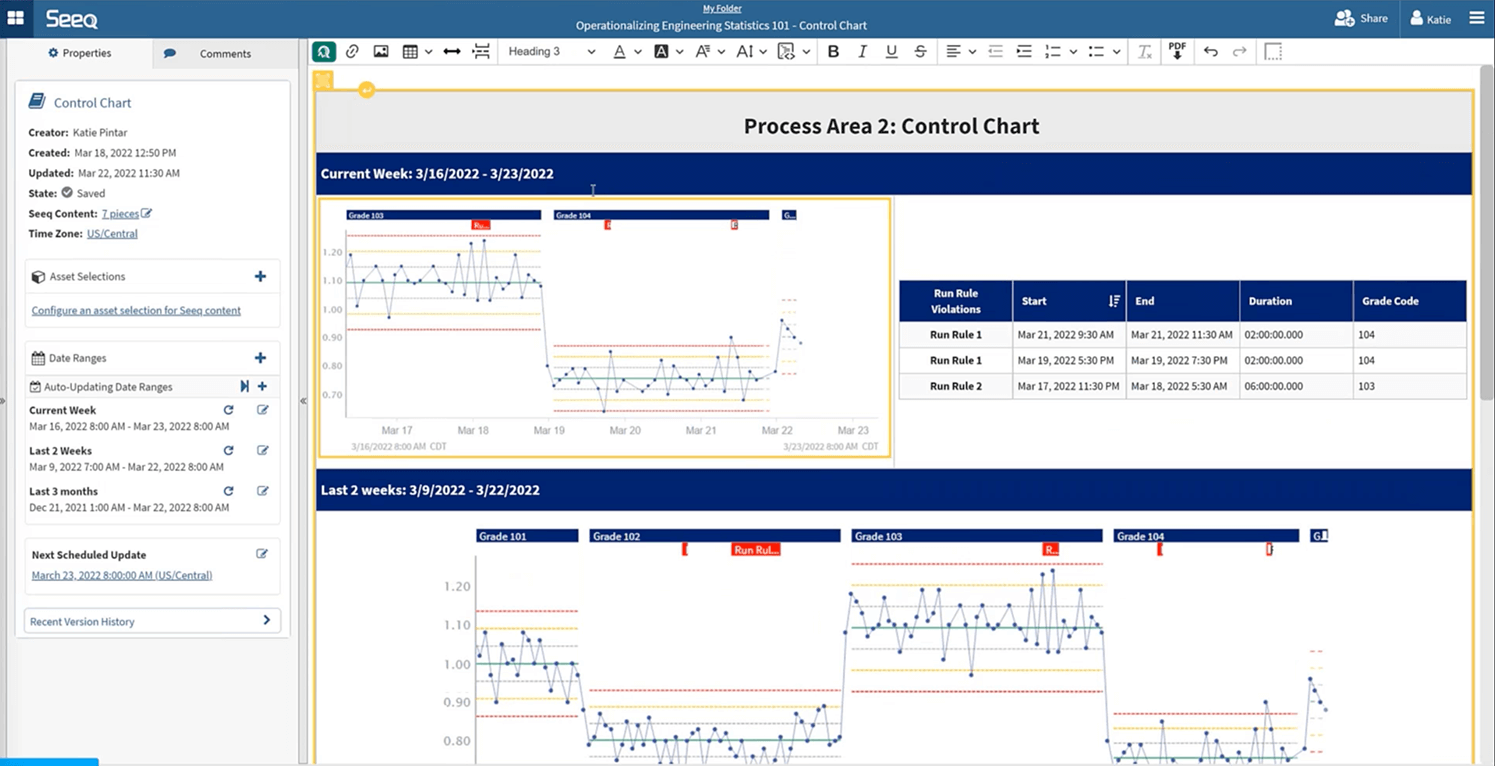
Once run rules are defined, users can view violations within a Seeq Organizer Topic where several different trends, tables, and histograms from the Workbench analysis can be compiled into a single dashboard that automatically updates. Manufacturers can monitor current run progress in addition to historical performance by viewing the Topic.
3. Process Capability Analysis: Cpk and Ppk
In many organizations, capability analysis is performed infrequently due to the considerable time required by process engineers and data analysts to make associated calculations. But Seeq asset groups can be set up to automatically calculate Cpks and Ppks, making frequent analyses more feasible.
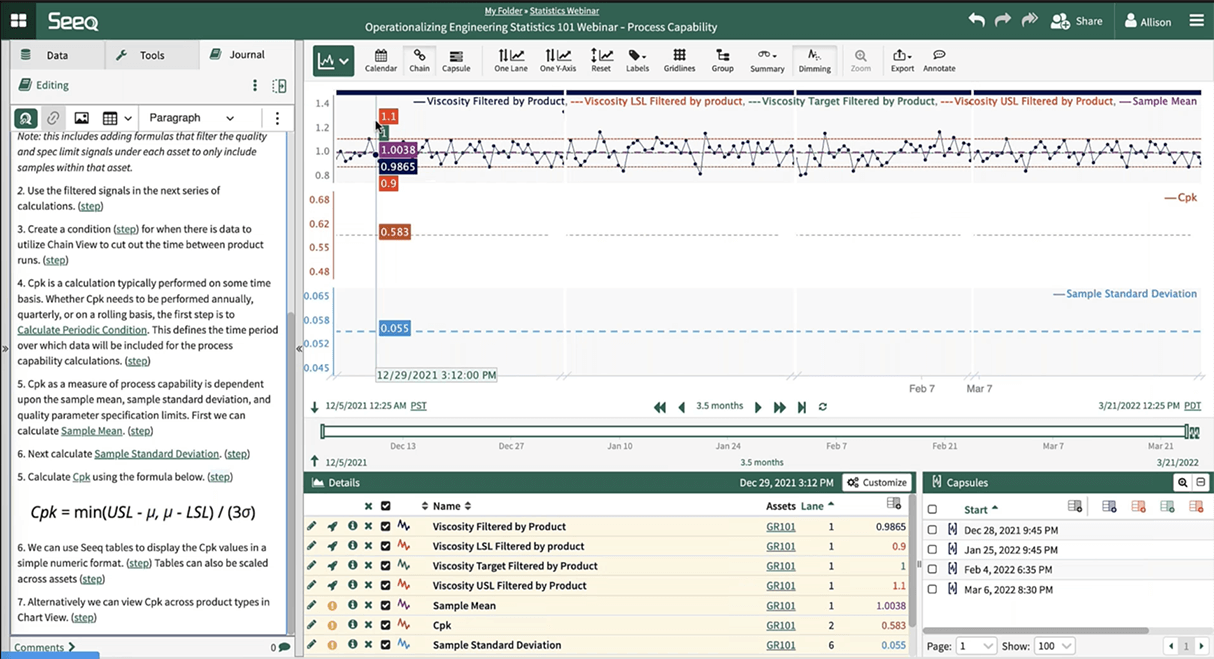
Seeq asset groups can be used to correlate assets with different product types. Users can perform a Cpk calculation on one product grade, then rapidly scale it across multiple product grades. The use of rolling conditions ensures the data is updated in near-real time for continuous analysis.
With the most up-to-date information, teams can leverage the data to inform business decisions.
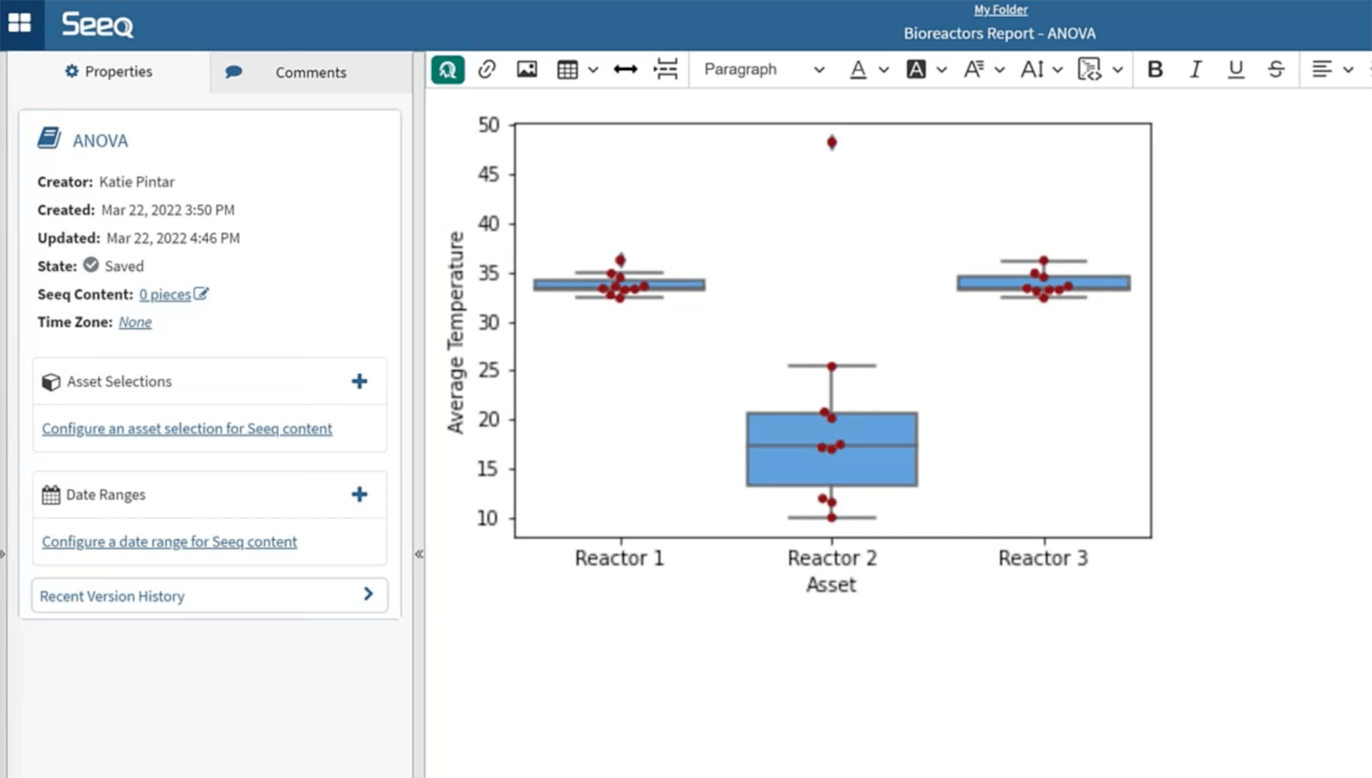
4. Analysis of Variance (ANOVA)
Users can also create statistical analyses and plots, such as an ANOVA to compare variances across means, in Seeq Data Lab. Traditionally, data preparation for statistical analysis was static. Configuring it properly was extremely time-consuming, and updating analyses as new information became available was near-impossible.
Seeq’s connection to disparate data sources and automated data alignment simplifies the data preparation process so users can more easily view time periods of interest. It also empowers engineers, data scientists, and production groups to collaborate more easily across functional teams and among multiple data repositories. This results in less time spent gathering and preparing the data, providing more time spent pursuing valuable business objectives.
Seeq Data Lab, which brings Python and Seeq together using Jupyter Notebooks, provides the option to use the custom SPy or Seeq Python library to push, pull, and manipulate data. Using Data Lab, users can build out statistical analyses using their desired Python libraries, and can create their own Add-on tools to simplify commonly used workflows and create seamless collaboration.
To begin, users open a Jupyter Notebook and import the custom SPy library to pull in data and manipulate it. Spy.search is used to find data, and spy.pull is used to pull in signal and condition data during the desired timeframe. Asset groups can then be created in Workbench to organize and contextualize data prior to processing in Data Lab.
Once data is loaded into Data Lab, the data frame can be formatted, in this case using the Pandas library, for use in creating an ANOVA plot and table. By creating a simple Add-on in Workbench, users can operationalize the workflow and send it to an Organizer Topic.
Start Operationalizing Your Engineering Statistics
So, what are you waiting for? Download the full webinar today to view these methods in action, and begin operationalizing your engineering statistics to meet organizational objectives, like improved OEE and sustainability.