
Methodical Data Alignment: An Overlooked Data Cleansing Step – Part 1
Accurate data alignment can be key to identifying accurate process insights and yielding valuable process savings.
Accurate data alignment can be the most challenging part of creating process calculations, finding correlations, and developing prediction models. Often overlooked, this data cleansing step may be even more critical than smoothing noisy signals and removing data outliers.
The Importance of Accurate Data Alignment
The need for data alignment stems from time delays present in the industrial process. Time delays, also referred to as dead time or transport delay, can result from industrial equipment and designs, such as conveyor belts, extrusion processes, screw conveyors, process piping/tankage, plug flow reactors, and analyzer sampling lines.
In addition to equipment and design induced sources, time delays may also arise when lab-measured values, referred to as Laboratory Information Management System (LIMS) data, are integral to analytics calculations. Lab values are often reported at variable time intervals following the actual process operation and are not necessarily time stamped to coincide with the corresponding, earlier process operation.
There are four categories of data alignment use cases prevalent across the process manufacturing industries:
- Known time delay – The time delay resulting from the transportation of material at a given speed or velocity (across some distance) can mask strong correlations between upstream and downstream signals, resulting in poor modeling results if not accounted for by a data alignment step.
- Variable time delay – Here the time delay is variable and a function of production speed, storage volumes, etc. but can be calculated based on measured/known process parameters.
- Before/after comparisons – Related to process experimentation and optimization, there is a recurring need to calculate and compare process metrics before and after some identified process event, such as a process additive feed being turned on, a unit restart, equipment maintenance, a controller setpoint being adjusted, etc.
- Process and analytical (LIMS) data – When trying to correlate process signals with analytical results, work is often needed to align the process signals and subsequent analytical results. In some cases, the alignment can be based on sequential, consistently reported lab data values. In other cases, more sophisticated logic, such as connecting process operation and lab results by matching id properties, is needed.
Without modern analytics solutions, completing these data analytics use cases can be very time consuming and tedious. Fortunately, flexible, fully-featured advanced analytics solutions, like Seeq, enable customized alignment methods, a crucial feature as each scenario is unique. Because these use cases often involve production quality or process optimization efforts, the proper alignment of data can be key to identifying accurate process insights and yielding valuable process savings.
Known Time Delay
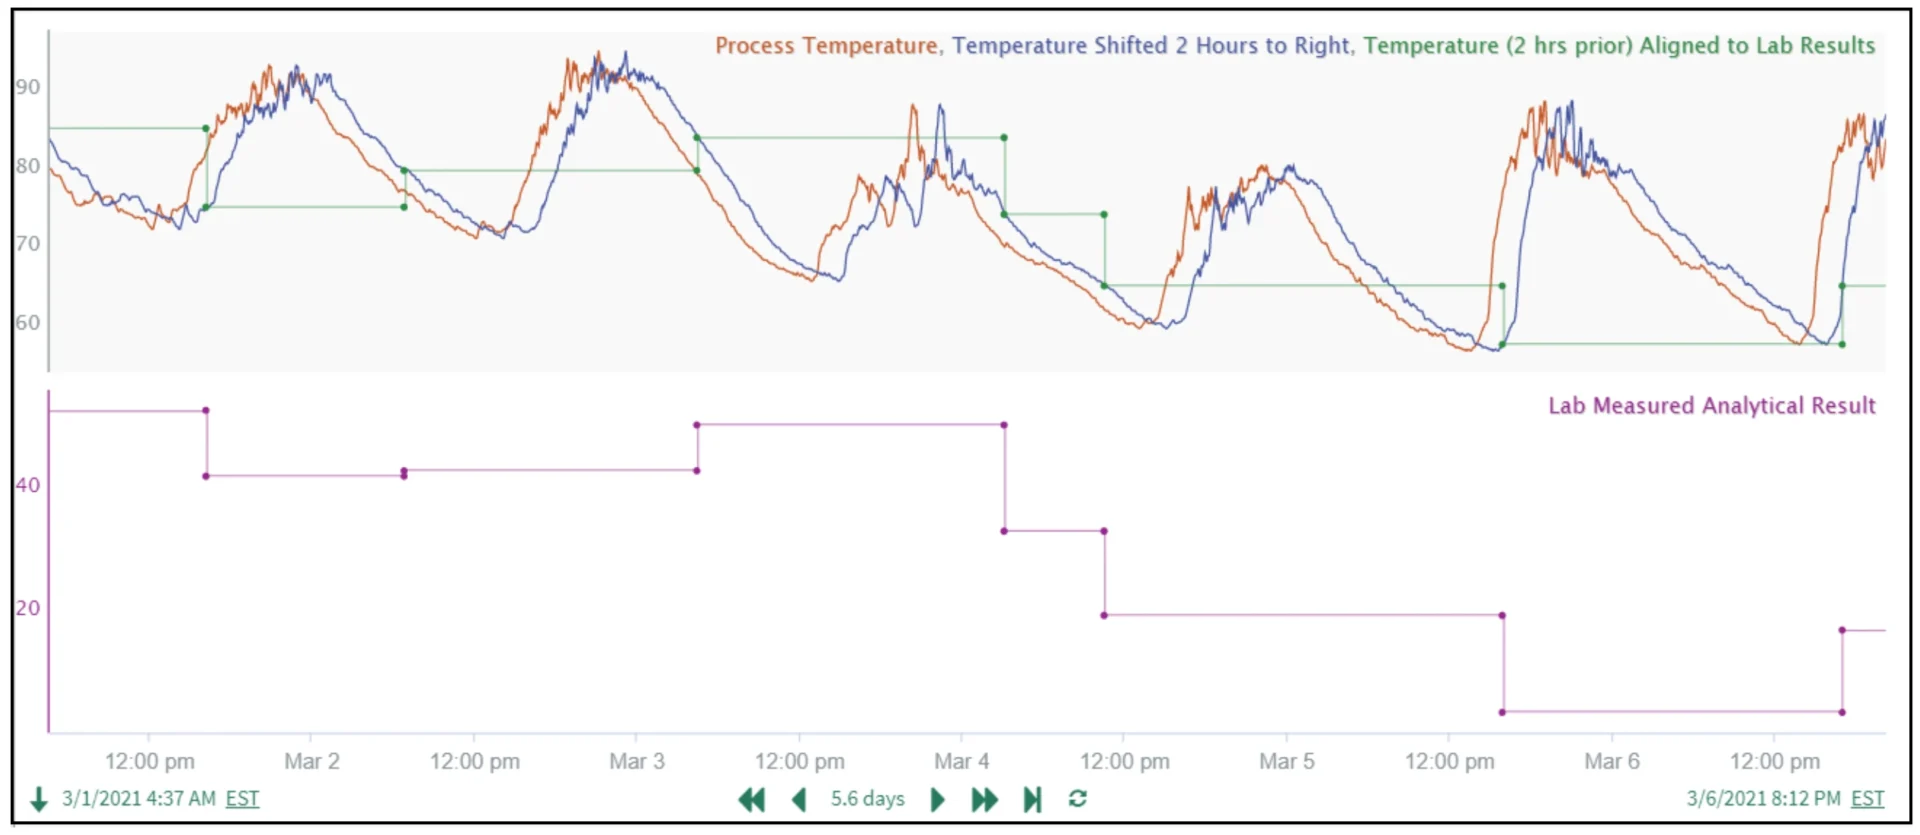
The goal of this use case is to correlate a process signal, in this case temperature, with a later reported lab result. It is known that the lab result is consistently reported two hours after the process operation that would most correlate. Therefore, the “Process Temperature” signal (Figure 1) needs to be shifted two hours to the right in time and then sampled for each unique “Lab Measured Analytical Result” value. Seeq Formula’s move() and resample() functions are ideal for this purpose, and the “Temperature Aligned to Lab Results” (2 hours prior) , seen in Figure 1, can be quickly generated from the raw data.
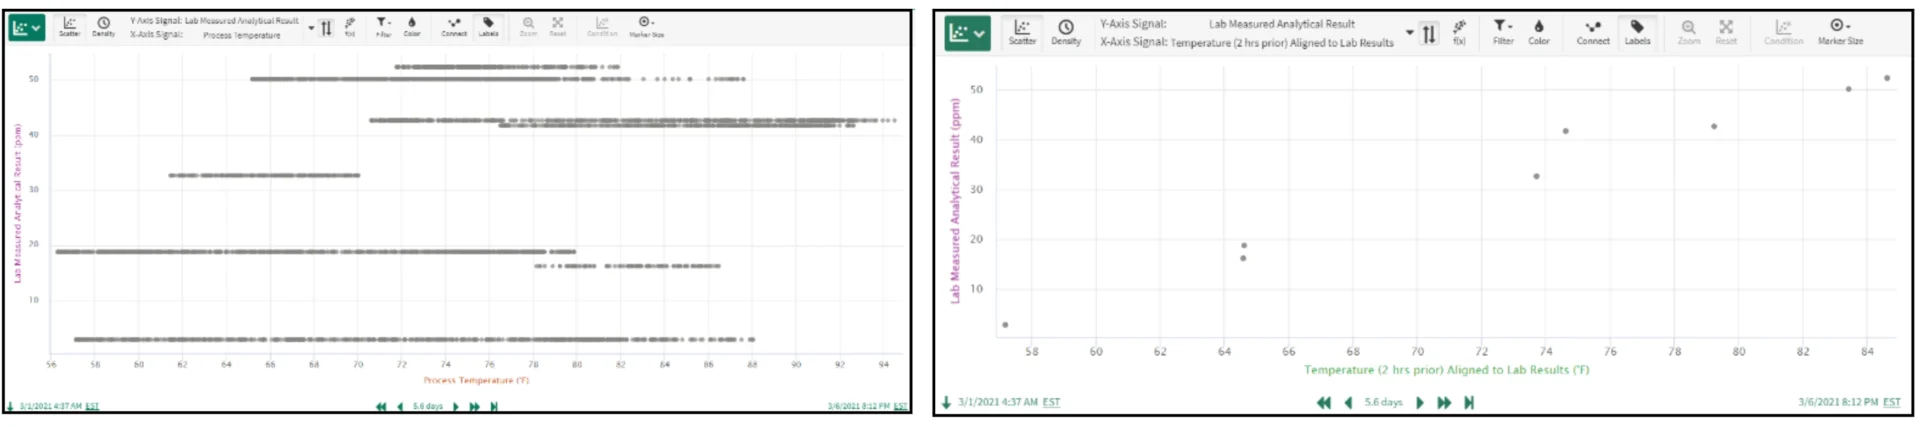
The resulting value is made visually evident by comparing two XY plots of the lab result and raw/aligned temperatures (Figure 2).
Variable Time Delay
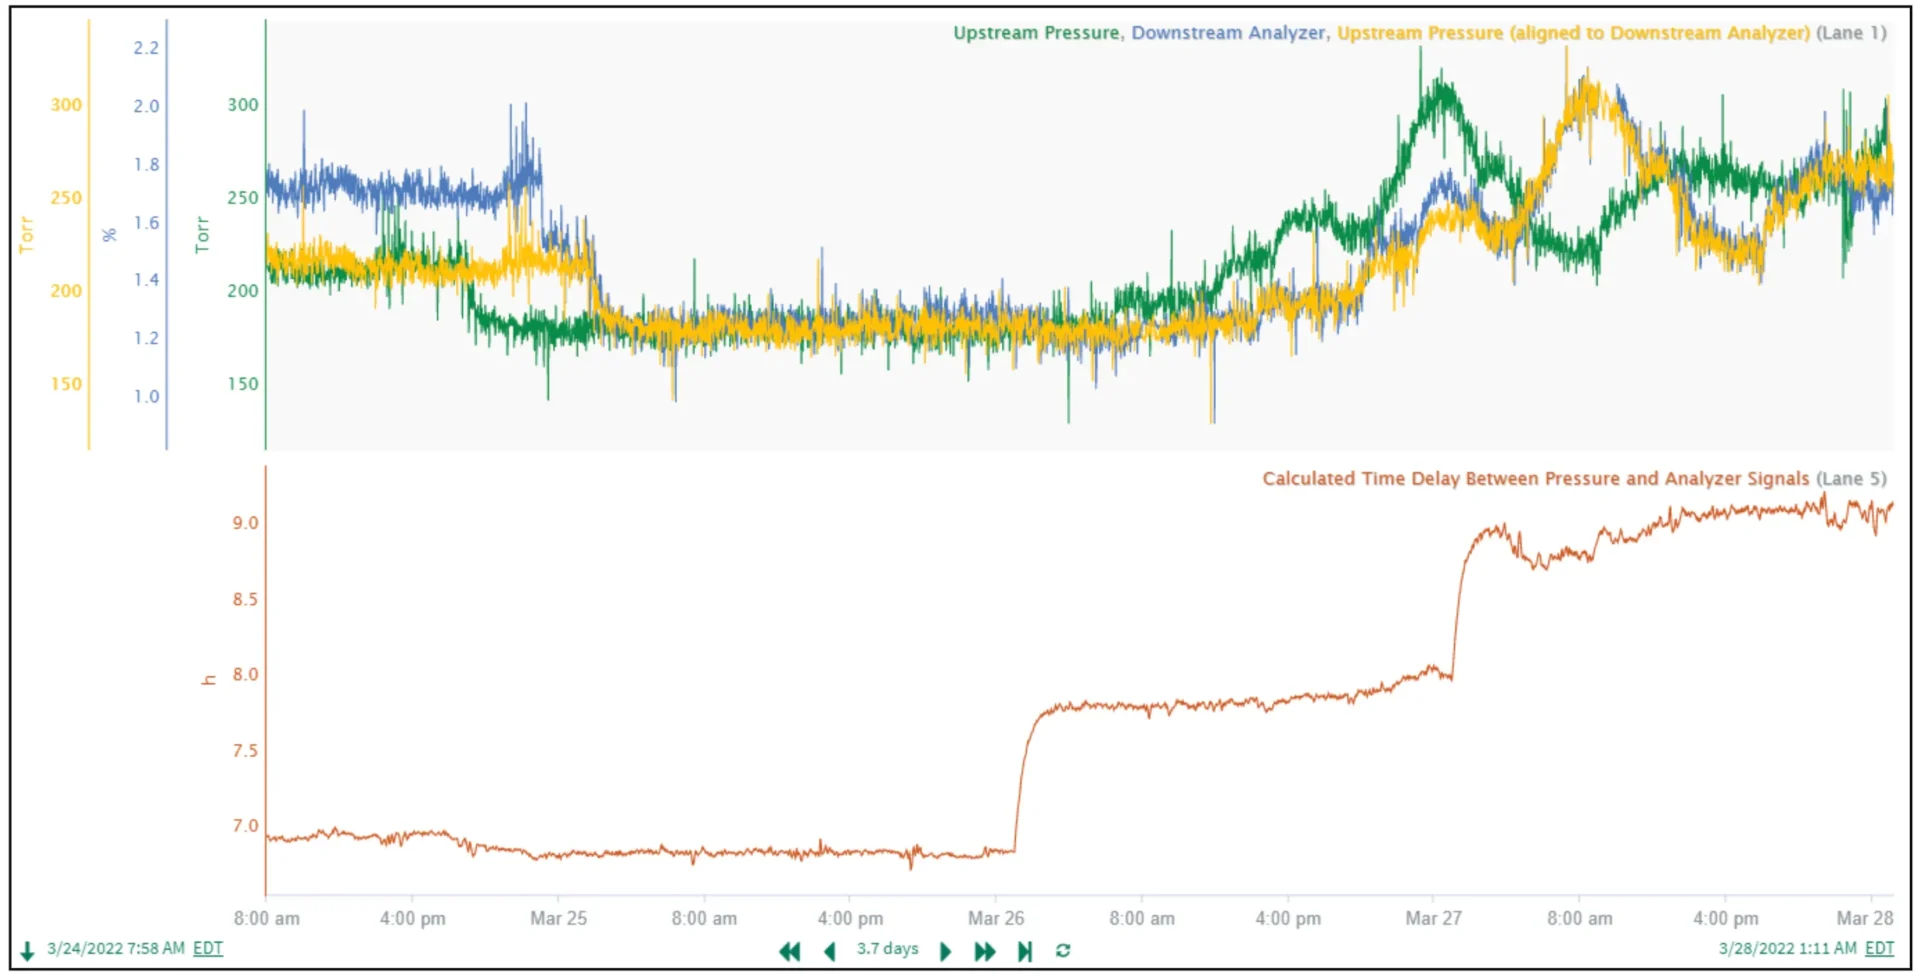
This use case is similar to the previous: correlating two measurements separated by a time delay, but with an additional complication. Here, the time delay is variable and based on the physics of a material transport distance. Changes in an upstream pressure physically take many hours to work through equipment/piping and influence a downstream analyzer signal. The number of hours of time delay can be calculated as the transport distance divided by the highly variable production line speed. Seeq Formula’s move() function accepts a variable time delay, which enables variable time shifting to produce the aligned pressure signal (yellow trend in Figure 3) as the “Calculated Time Delay” signal changes. Trend inspection confirms the effectiveness of applying the variable time shift, shown visually in Seeq when the “Downstream Analyzer” signal (blue) moves simultaneously with the aligned pressure (yellow).
Data Cleansing Time Savings and Increased Process Performance
The ability to precisely align data values related to inherent time delays and process events saves significant time preparing data for calculations and modeling. It is essential to achieving accurate data driven process insights and, ultimately, leads to better process adjustments and more optimal process performance.
Do you have a use case like the ones described above? You can see all the details on the analytics features and formulas needed for these use case categories described above in a post on seeq.org.
Stay tuned for the second part of this blog post for details on two more use cases where accurate data alignment is often overlooked.
If you are ready to discuss how Seeq can improve your operations, please contact us to speak with one of our industry experts and schedule a demo today.