Hands-on Training
- Quickly learn skills useful for your role
- Hands-on, industry-relevant exercises
- Certifications
How to Access Training
- Get Branch Code* (from Seeq home screen or your admin)
- Click “Register” on training.seeq.com
- Choose your role
Get Started

Seeq is an advanced analytics, AI, and enterprise monitoring SaaS platform purpose-built for the intricacies of industrial time series data.
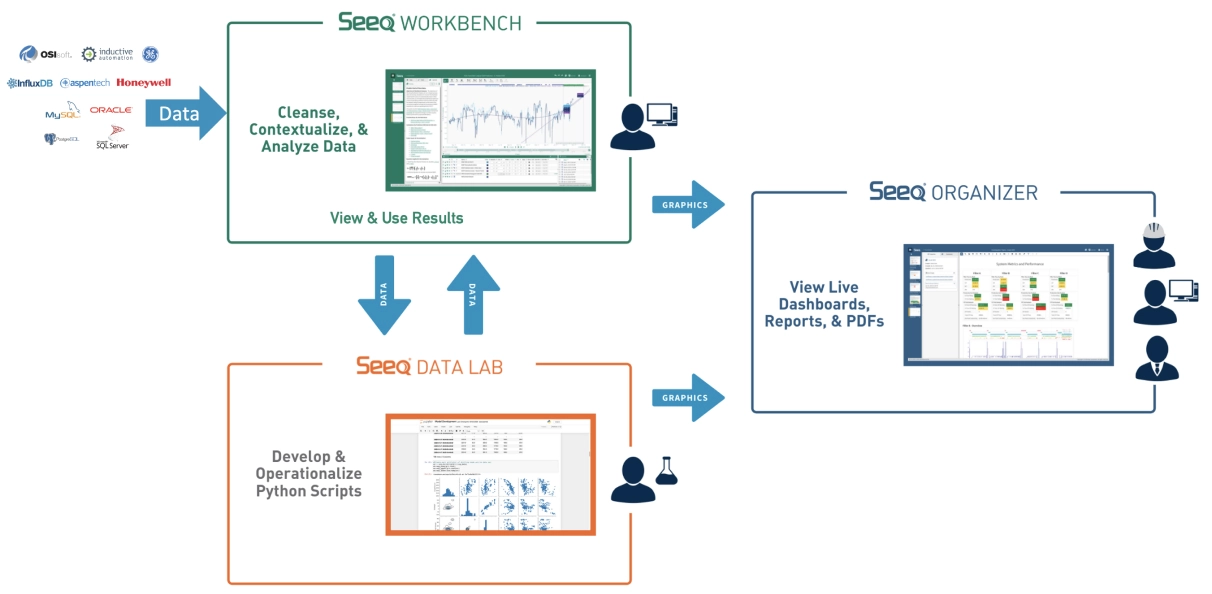
Seeq is comprised of the Seeq Platform and four HTML5 browser-based apps:
Seeq enables you to operationalize your data science workflows and put scripts to work throughout your organization to make impact for your business, at scale.
Connect to data, then quickly visualize, cleanse and prepare, and analyze data in Workbench.
Use your contextualized, prepped data in python scripts, machine learning & other Add-ons (yours, ours, or 3rd party) in Data Lab.
Compile your insights into auto-updating reports & dashboards in Organizer.
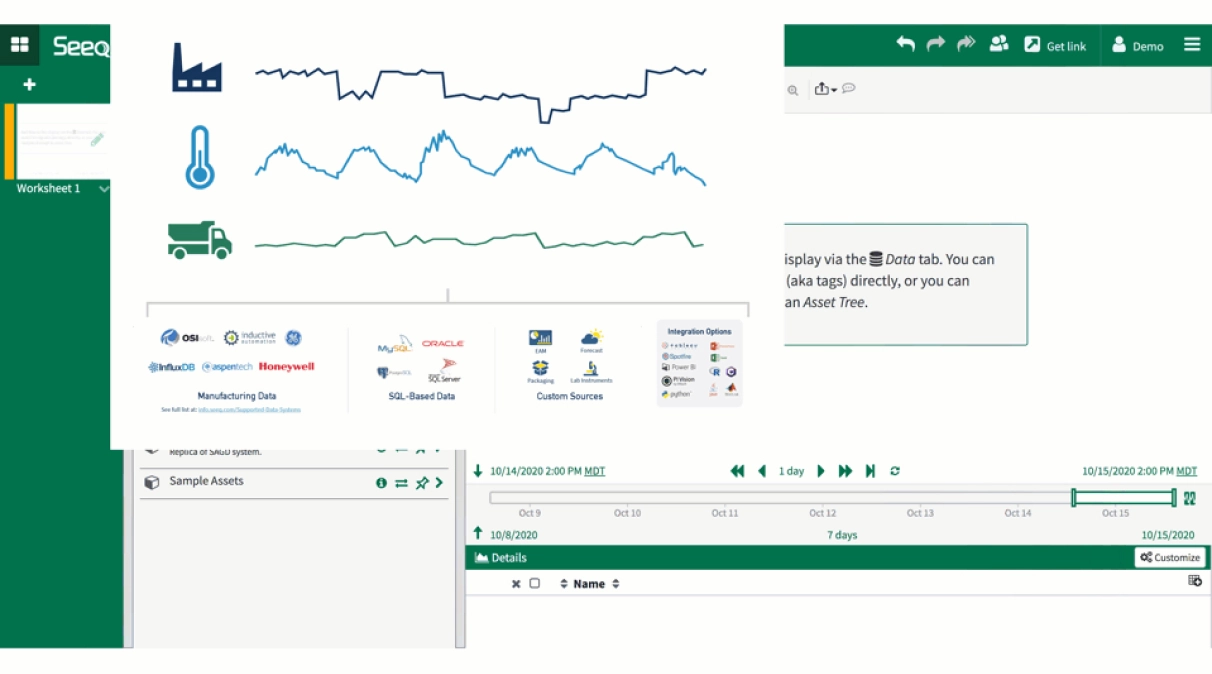
Search for your data and click to add it to the trend. Pull the right data into your scripts & Add-ons, on a schedule or on demand.
Your IT/Admin sets up data connectors to historians, SQL data, & more.
Seeq handles data with different sample spacing (gridding) using automatic cross-interpolation, eliminating hours of manual work.
Scale by deploying analyses across data asset structures (preexisting or easily built in Seeq).
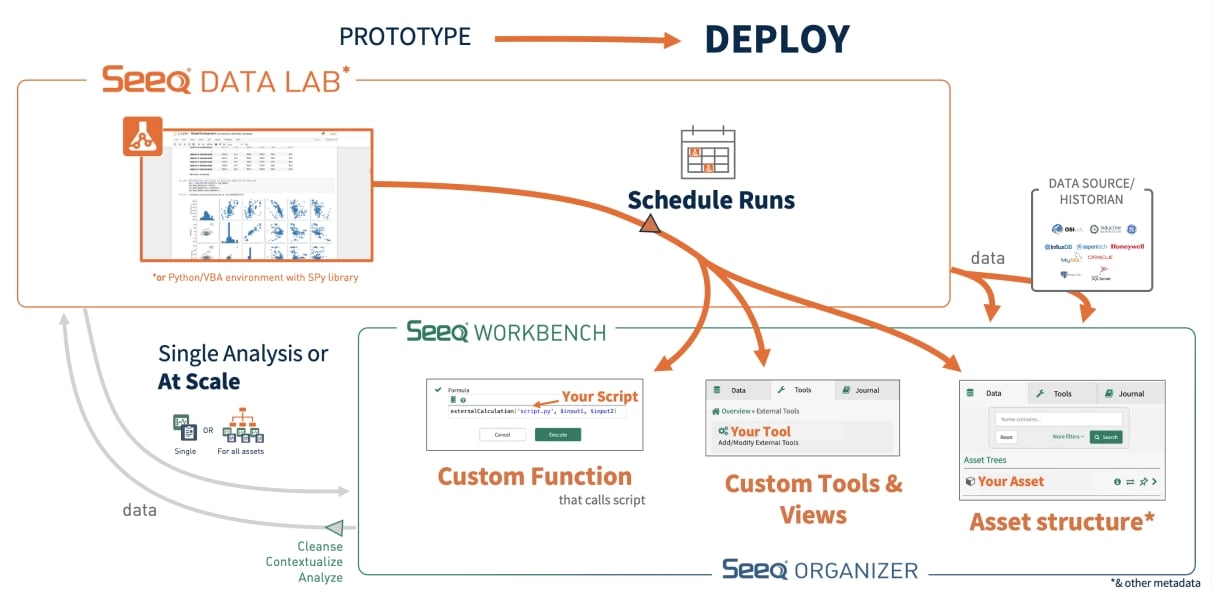
Yours: Get more value out of your scripts by integrating with analytics, reports, & dashboards used throughout your organization. And, build your own custom tool & visualization Add-ons that can be used by your colleagues in Workbench.
Ours: Choose from our gallery of Add-ons and extensibility features includes specialty ML such as Causality analysis, ML-driven anomaly detection, large-scale monitoring, & more.
Theirs: Integrate with SageMaker, Azure ML Studio, & other 3rd-party tools. Read more.
Schedule script runs to fully operationalize your results.
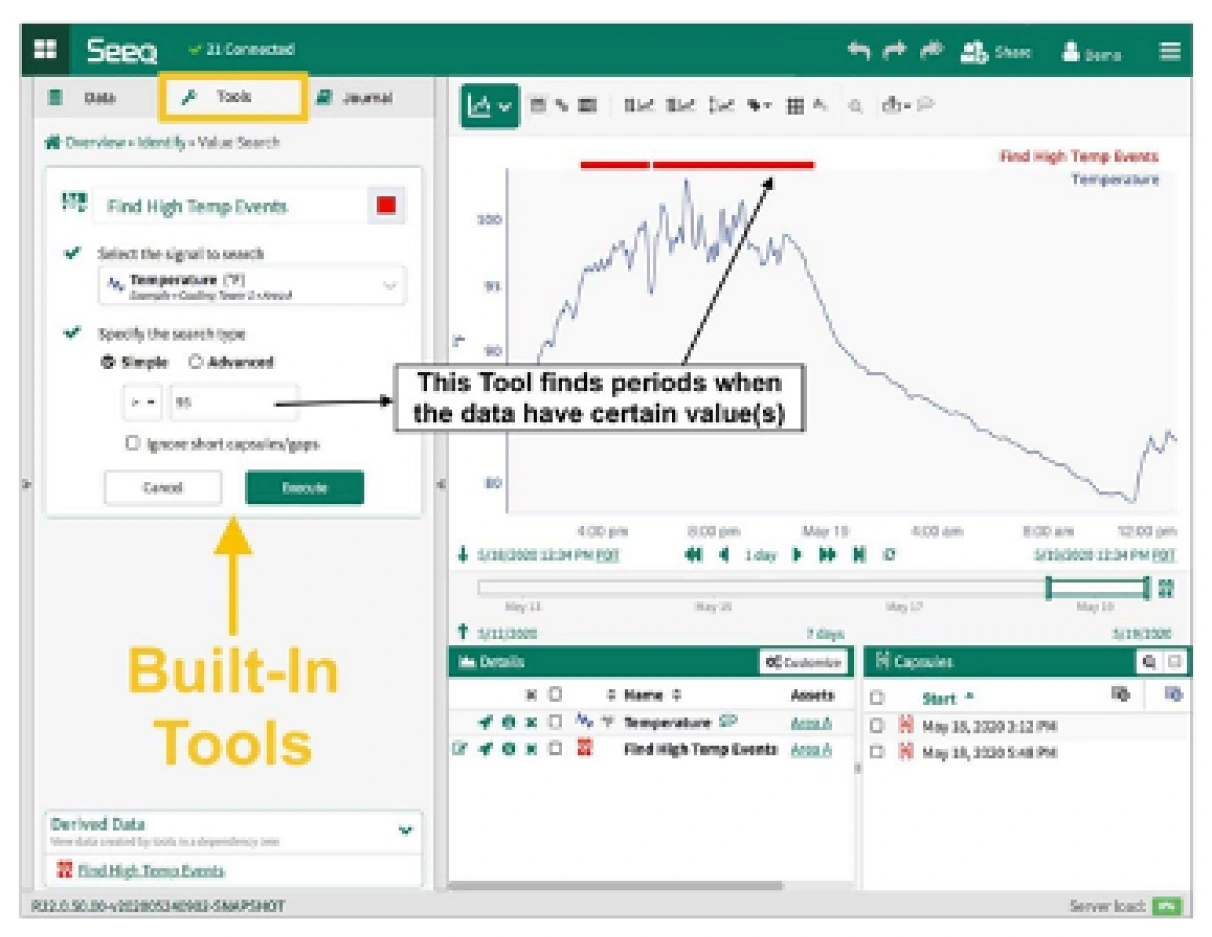
Seeq Workbench has built-in tools for:
Seeq tools refresh their calculations as new data are recorded on connected datasources, continuously prepping data for use in your scripts & Add-ons.
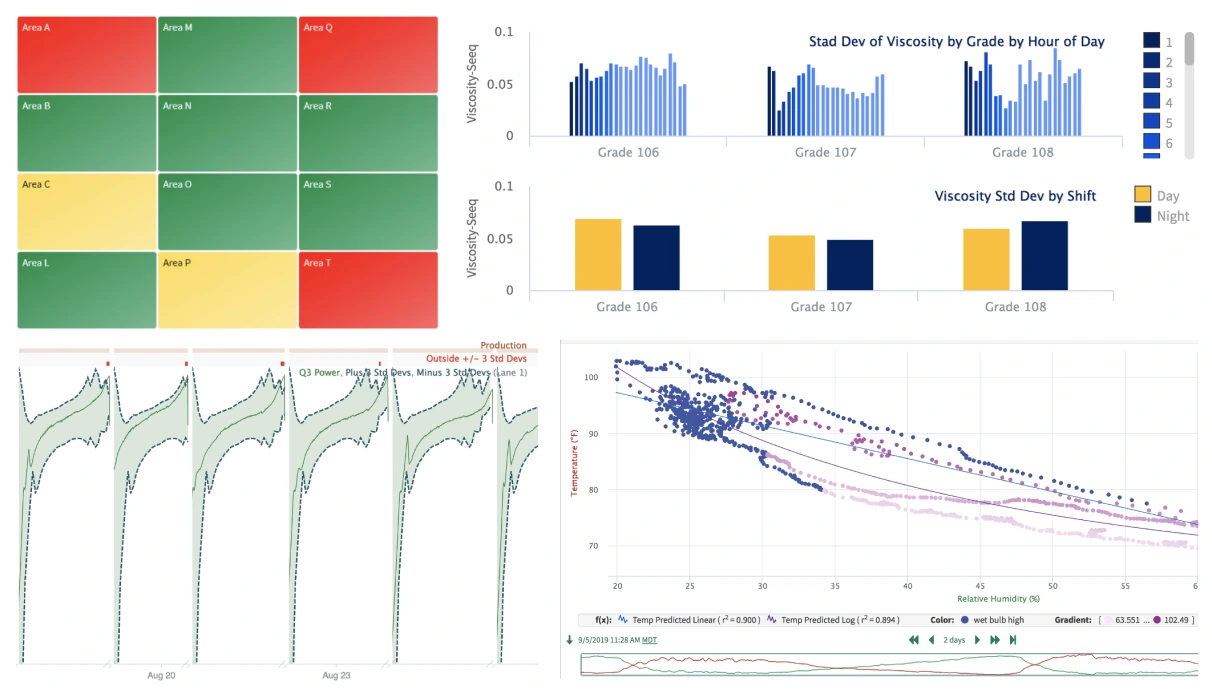
Interactive trending enables you to find insights quickly.
Seeq also features XY plots, bar graphs, tables, a variety of built-in chart types, asset tree maps that show you alerts occurring across groups of similar units, various “event” views, & more.
Bookmark any step or view to quickly return to that moment in your analysis.
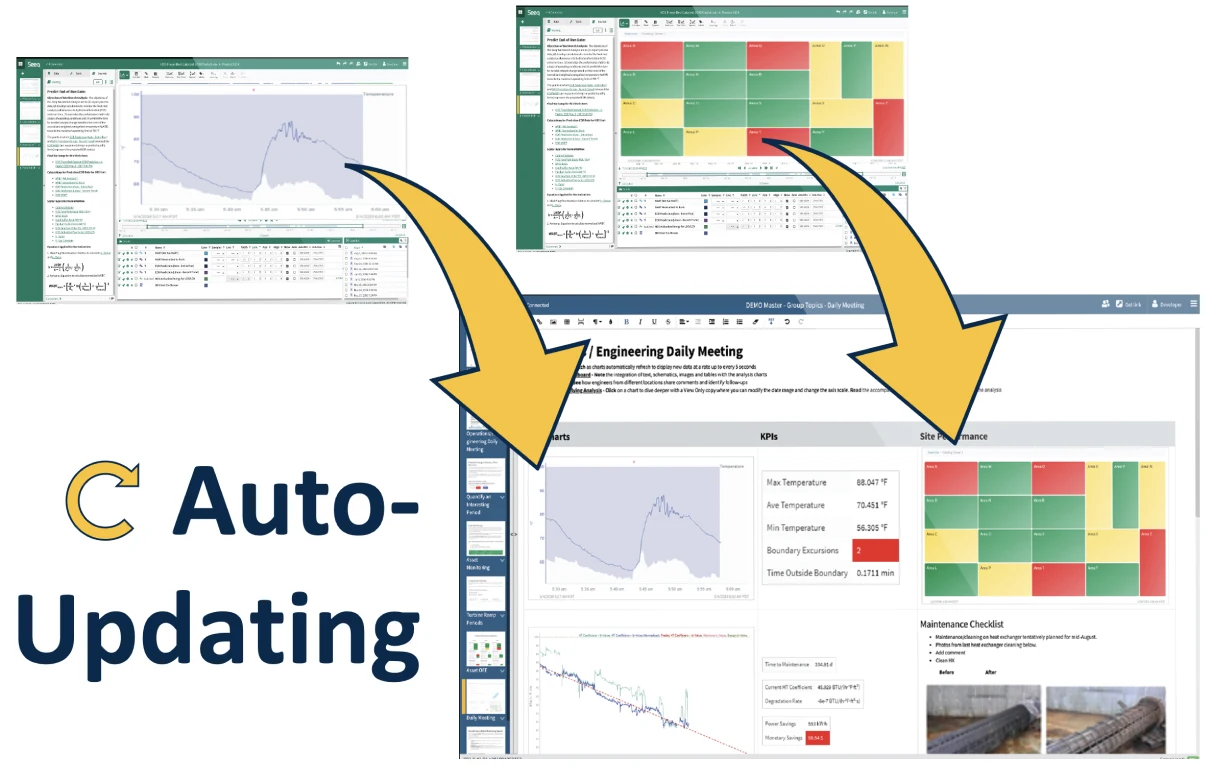
in the Organizer app.
Compile analytics figures with other information into reports or dashboards. Then, set them to auto-update on-demand or on schedule as needed.

How to Access Training

Visit support.seeq.com for the Knowledge Base, Videos, Forum, Office Hours, and more.
Also accessible through your Seeq Homescreen.