Hands-on Training
- Quickly learn skills useful for your role
- Hands-on, industry-relevant exercises
- Certifications
How to Access Training
- Get Branch Code* (from Seeq home screen or your admin)
- Click “Register” on training.seeq.com
- Choose your role
Get Started

Seeq is an advanced analytics, AI, and enterprise monitoring SaaS platform purpose-built for the intricacies of industrial time series data.
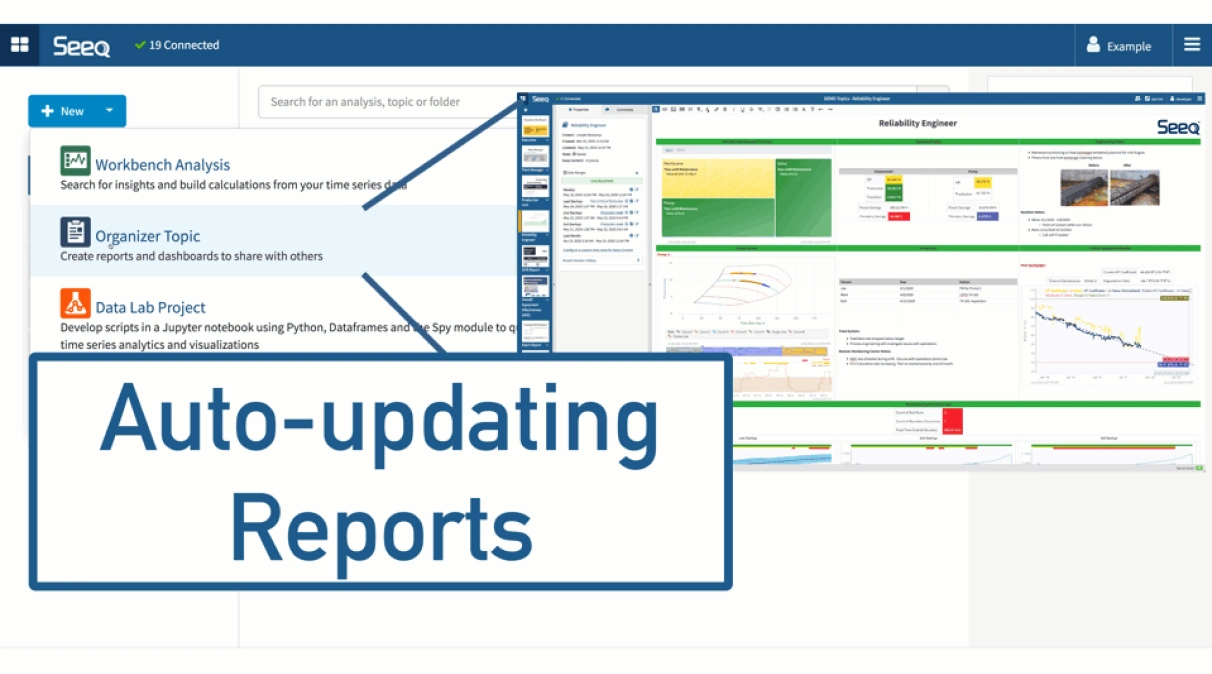
Seeq is comprised of the Seeq Platform and four HTML5 browser-based apps:
So you can work, collaborate, & share, anytime & anywhere. Analytics & visualizations can auto-update as new data are recorded.
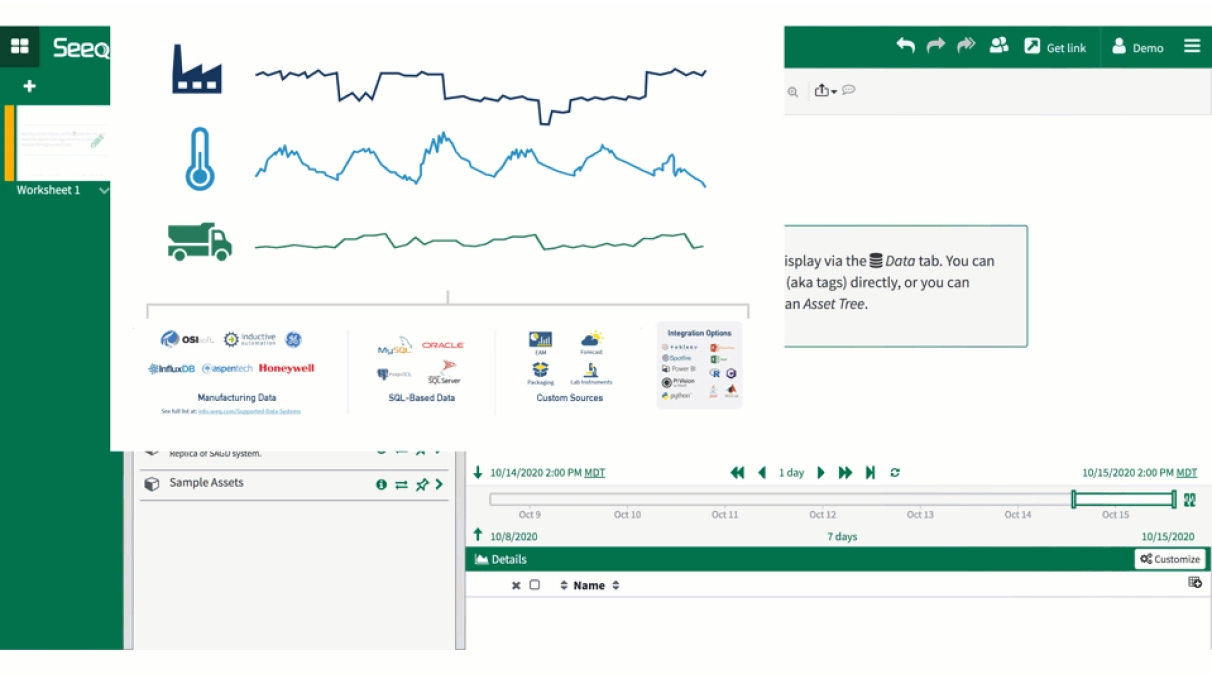
Search for your data and click to add it to the trend.
Your IT/Admin sets up data connectors to historians, SQL data, & much more.
Seeq handles data with different sample spacing (gridding) using automatic cross-interpolation, eliminating hours of manual work.
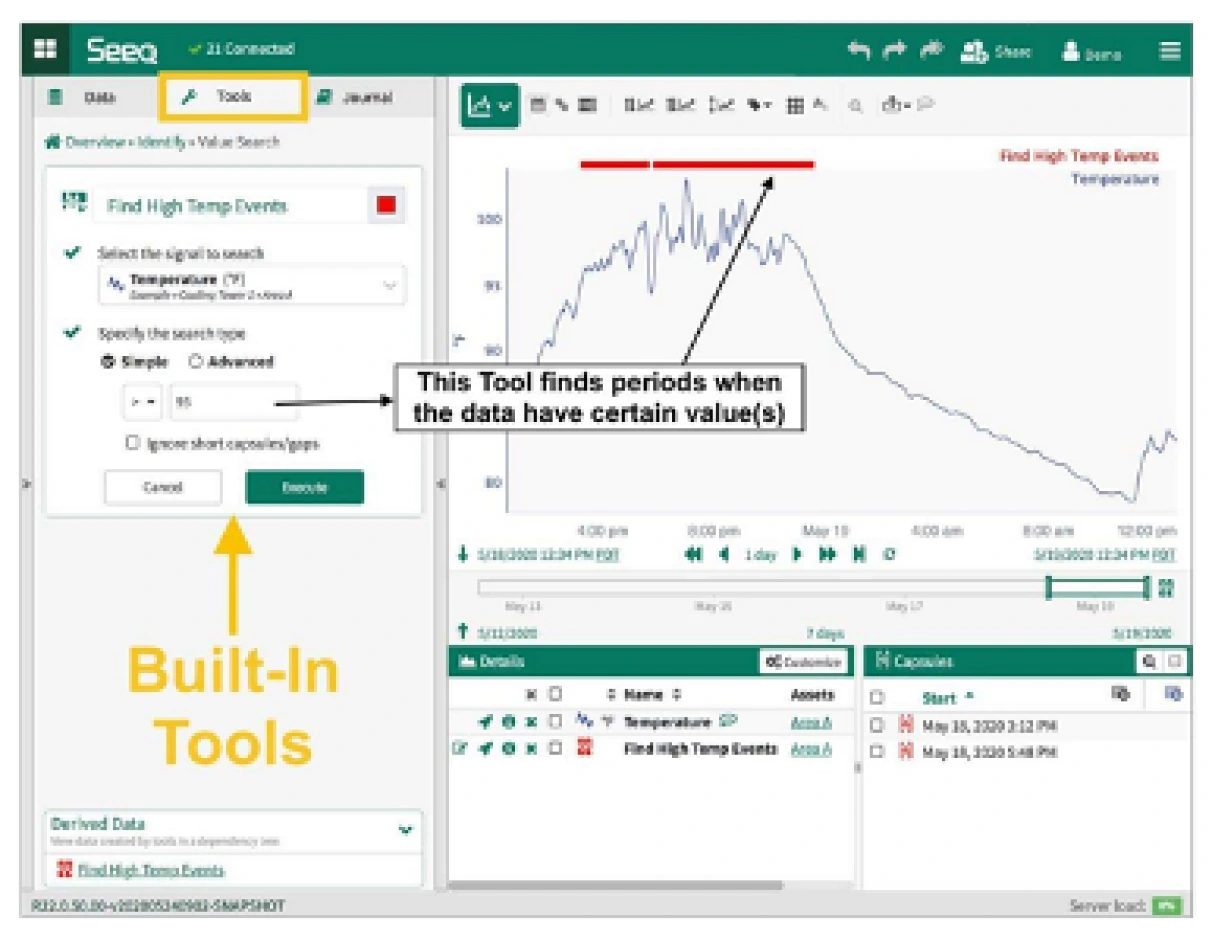
with point-&-click tools in the Workbench app.
Seeq has built-in tools for:
Deploy Python scripts, use no-code ML Add-ons, and make your own Add-ons in Data Lab.
Interactive trending enables you to find insights quickly.
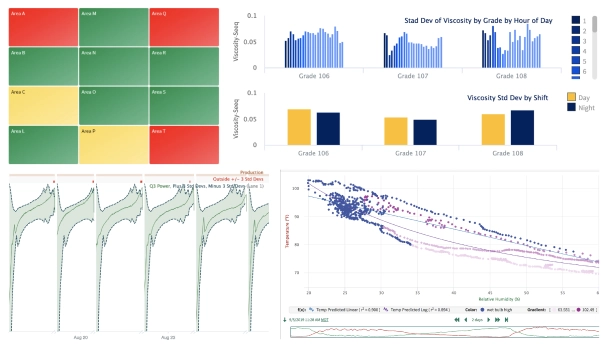
Seeq also features XY plots, bar graphs, tables, a variety of built-in chart types, asset tree maps that show you alerts occurring across groups of similar units, various “event” views, & more.
Bookmark any step or view to quickly return to that moment in your analysis.
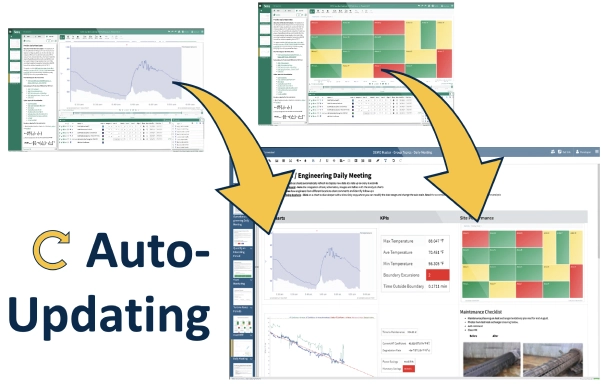
In the Organizer app.
Compile analytics figures with other information into reports or dashboards. Then, set them to auto-update on-demand or on schedule as needed.

How to Access Training

Visit support.seeq.com for the Knowledge Base, Videos, Forum, Office Hours, and more.
Also accessible through your Seeq Homescreen.