Methane Plume Detection
Challenge
Oil and gas operators have difficulty pinpointing methane leaks. While methane data is available from a variety of satellite providers, the data is sparse, with measurements only available once a day. Additionally, there is no method to integrate this satellite data with other data of interest, such as weather or process data. As a result, it is difficult to quantify events that occur and nearly impossible to identify events as they occur so that they can be mitigated or identify an event before it occurs so that it can be prevented.
Solution
With Seeq, users can analyze satellite, weather, and process data in a single location. The satellite data can be used to identify when an event occurs, and the weather data can be used to characterize the dispersion model during the event. Finally, process data can be used to identify the source of the leak during an event, as well as quantify the event duration and amount emitted.
Results
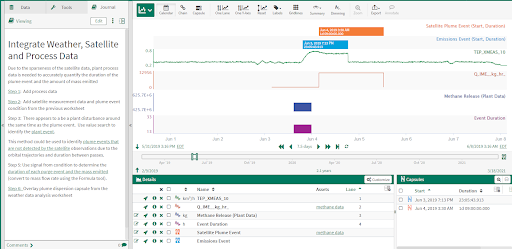
Overlaying the process data, weather data, and satellite data gives greater insight into the emissions events, specifically: duration of event, amount emitted, and dispersion of plume. This insight can be used to characterize process events that cause a methane emissions event. In turn, this allows users to identify events as they occur so that they can be mitigated or even identify early indicators that an event is about to occur so that it can be prevented.
Data Sources
• NOAA weather connector
• Satellite data
Data Cleansing
• Data wrangling applied to the raw signals, e.g. filters, capsules with time periods of interest
Calculations and Conditions
• Value Search
• Signal from Condition
• Formula