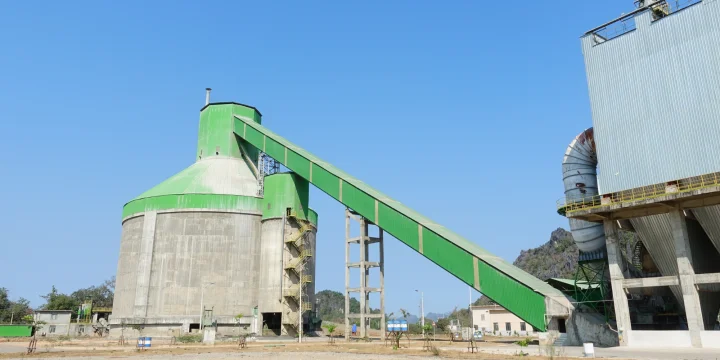
Clinker Production Monitoring
Customer
S&P 500 supplier of aggregates and heavy building materials
Challenge
An S&P 500 supplier of aggregates and heavy building materials needed a better way to monitor its production of clinker, the primary component in the manufacturing of cement. Cement production reports are critical to understanding how the plant is performing, especially how the calculated yield compares with the measured total.
But traditionally, compiling these reports is a time-consuming and cumbersome process for the company’s supply chain and engineering personnel. That’s because plant personnel must manipulate spreadsheet analyses to filter out poor-quality clinker and times when the plant is not in production due to an outage. Additionally, different types of clinker require different production calculations.
Due to the complexity of calculations performed in Excel spreadsheets, there is a high risk of errors in the reports. The company needed to save engineering time and ensure consistency when generating these important reports.
Solution
Seeq advanced analytics were used to:
- Calculate clinker from kiln feed and kiln slag signal
- Identify time periods for shifts and operation modes when clinker was produced
The company used the Seeq advanced analytics application to calculate the tons of clinker produced per 12-hour shift, excluding weekends or times when the kiln was down for a planned outage. The updated metric can simply be refreshed with the most recent data each day and then shared across the company, enabling collaboration that would previously have been too difficult to do.
Data Sources
- Wonderware Historian
Results
- Provide organized template for daily stand-up meeting saving four hours of supervisor time per day
- Quickly identify shifts not meeting production goals
- Compare calculated clinker to measured values to monitor sensor accuracy