
Building a Better Batch with Seeq
Building a Better Batch
Why Batch is Different
The discrete, repeated steps of a batch process fundamentally set it apart from its continuous counterparts in the pharmaceutical, specialty chemical, and food & beverage industries. These differences mean subject matter experts (SMEs) need to use different tactics and metrics to troubleshoot issues and measure performance.
In batch processing, repetition is everywhere. Valves opening and closing; agitators starting and stopping; vessels heating up, cooling down, filling up, and emptying; over and over. As the process repeats, patterns in time series process data emerge. Eliminating variability and streamlining the process forms the backbone of operational excellence and overall equipment effectiveness initiatives.
Seeq’s capsule structure allows SMEs to identify and isolate periods of interest based on the patterns in batch data. Some of these patterns are expected and planned within a batch, such as a reactor heat up or cool down. However, while they may follow the same pattern, each instance is not identical. Some are faster or slower, or more or less extreme.
It is through these differences that SME’s can detect and diagnose process irregularities, and then work to ultimately improve their process by minimizing or eliminating variability. Capsules can be configured to describe any set of process conditions with specific entry and exit criteria, and once configured, automatically record and group capsules. Using Seeq’s Chain and Capsule Time View, SMEs can view periods of interest end-to-end or overlaid, enabling rapid identification of differences in operation. Part of Seeq’s value stems from the ease and speed with which it enables this type of insight.
The Power of Data Source Integration
In addition to the intuitive analysis Seeq provides, it also seamlessly integrates disparate data sources, whether they are housed on-premises or in the cloud. Connecting multiple data types to a single system not only saves time, and it provides opportunities for analysis that was not previously possible.
For example, with Seeq, a user can simultaneously see how lab data changes with process parameters. If an SME suspects high temperature will be detrimental to final product quality in a batch process, Seeq can be used to quickly identify each batch. The SME can then create a signal that displays the maximum temperature reached in each batch, or the amount of time spent above a specified temperature, by using the Value Search tool. The final assay from each batch can then be overlayed to determine if any correlation exists between high temperature, or time at a certain temperature, and poor final product quality.
Typically, there is a lag associated with lab data processing. Pulling samples and the subsequent analysis can take hours. This lag plagues SMEs as it becomes difficult to immediately tell which period of time-series data should be associated with a specific outcome observed in lab data. Seeq eases this burden by shifting the lab data signal by the typical process lag time via the Formula tool. Once the signals are synchronized, SMEs can more easily discern patterns in process conditions and their impact on product quality.
Golden Batch
A golden or best possible batch is a common benchmark or KPI in batch processing. The golden batch allows SMEs and decision makers to see the best-case scenario if all steps of a batch run optimally.
Seeq’s capsule functionality makes defining a golden batch quick and intuitive. A batch will often have a signal which can be used to name it. Using this signal, or by using another signal to define the beginning or end of a batch, Seeq can quickly bracket each batch as a condition. Figure 1 shows how Seeq brackets the reactor temperature for each batch, but also for each operation within a batch, each with its own capsule.
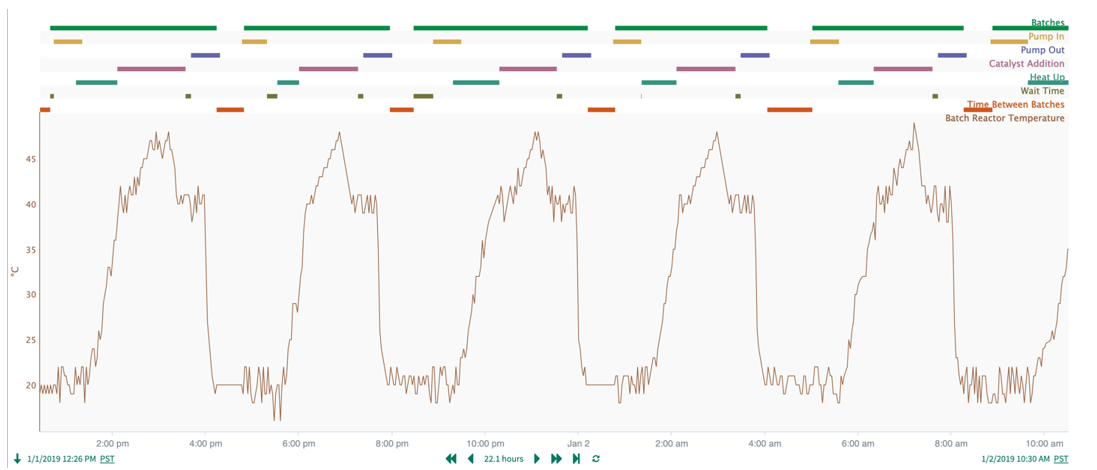
This level of detail allows SMEs to dive deeper into the causes of batch variability and address each root cause more quickly. Common sources of variability include temperature or flow limitations based on the process load during a batch. These differences would quickly rise to the surface following this analysis.
Given the quantifiable outputs Seeq’s analysis provides, this type of use case can be used to create a quick and powerful project justification for process improvement, or for procedural changes aimed at alleviating cooling or flow limitations which cause unwanted longer batch durations.
Once capsules are defined for batches and operations, the calculations are automatically applied to all future batches, as well as past batches if the signal used to build the analysis contains data. This allows SMEs to compile months or years of historical data from previous batches and campaigns for further analysis and comparison.
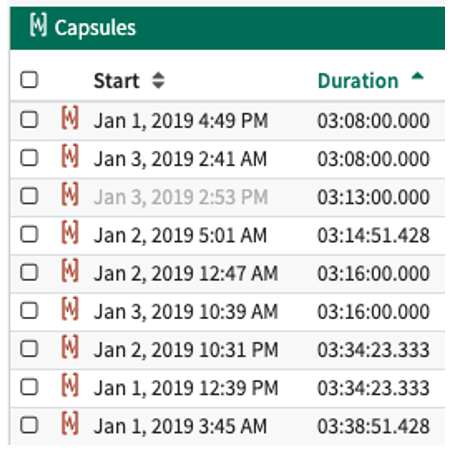
Batch capsules can quickly be transformed into a signal displaying the batch duration using the Signal from Condition tool. Once created, this auto updating signal will display the duration for all batches that stem from the original Batch ID, or from predefined batch start/stop triggers. Continuing the analysis, the capsules pane in the lower right of the Workbench user interface can be quickly filtered by duration, showing the fastest batch (Figure 2).
Batches can also be sorted by duration using the Histogram tool, enabling SMEs to see where any batch stacks up against the historical average, and to measure the standard deviation.
Capsule View
In addition to batch duration, things like temperature or flow profiles can yield important insights. The discrete nature of batch processing means that each subsequent batch is analogous to a unique trial of an experiment. Seeing how temperature or flow profiles vary, for example before or after an operator initiated change, provides important information related to the success of the adjustment. Using Seeq’s Capsule Time View, the profiles from multiple batches can be overlayed, revealing the differences among them (Figure 3).
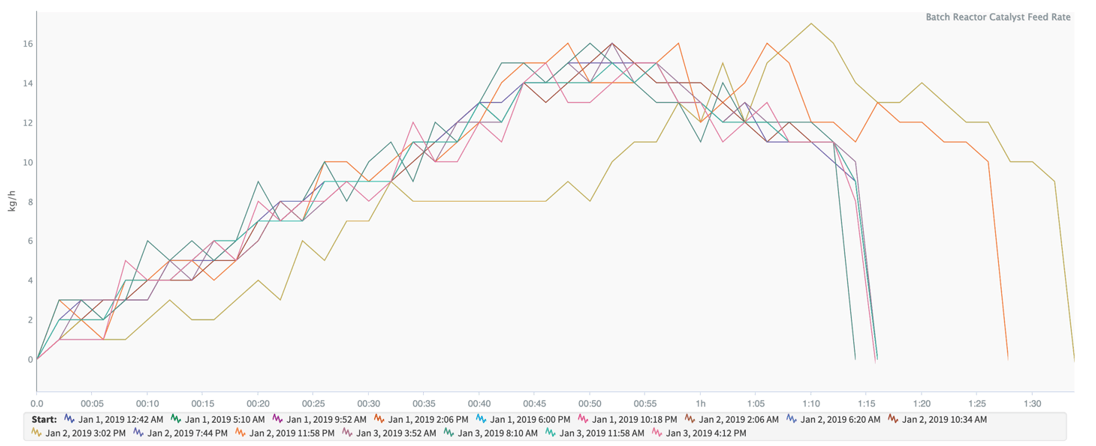
SMEs can use this information to determine the cause of variability within the process. Does adding catalyst more quickly cause some batches to heat up faster than others? Does the presence of an impurity cause some batches to dry slower than other batches without said impurity? These types of insights are created by identifying a cause-and-effect relationship between two pieces of information. Even if SMEs suspected a previous relationship, Seeq can help quickly quantify its impact in units of time, flow, or mass—empowering SMEs to quantify these improvements.
Creating Value with Seeq
Contextualizing data with Seeq improves SME efficiency, enhances productivity, and speeds time to insight. Seeq serves is a powerful diagnostic and quantification tool, allowing SMEs to simultaneously determine the cause and magnitude of batch variability.
Seeq’s capsule structure lends itself especially well to batch manufacturing, enabling comparisons and insights not previously possible with other spreadsheets. Isolating and determining the cause of variability between batches is quick and intuitive. With this knowledge, SMEs can confidently move forward with a project, assured that they have accurately quantified the root cause, and will be able to successfully implement a fix to provide economic value.
To see the technology in action, schedule a demo today.
To learn about the far-reaching effects of bad batches, download this infographic.