
Survey: Data Analytics in the Chemical Industry
How Today’s Chemical Industry Professionals Are Utilizing Data Analytics and Digitalization
Seeq recently conducted a poll of chemical industry professionals—process engineers, mechanical and reliability engineers, production managers, chemists, research professionals, and others—to get their take on the state of data analytics and digitalization. Some of the responses confirmed behaviors we’ve witnessed first-hand in recent years: the challenges of organizational silos and workflow inefficiencies, and a common set of high-value use cases across organizations. Other responses surprised us, read on to see why.
Organizational Silos
Organizations and their data are siloed. That might not be news to you. Data scientists, process subject matter experts (SMEs), and managers rarely interact despite working towards a common goal. Process data can be confined to a particular group or site due to any number of physical, geographical, or network barriers. According to the study, two of the more effective approaches to breaking down these barriers are federating data sources and embracing the cloud. Which ties to our experience: the percentage of customers running Seeq in public or private clouds doubled in 2020.
Workflow Inefficiencies
The most common data analytics workflow inefficiencies are shared across organizations. Eighty six percent of study respondents stated their key issues are visualizing, manipulating, and analyzing process data on a daily basis, and half of them saw room for improvement in all areas of their data analytics workflows.
Many of these inefficiencies occur in areas of the business where the lines between IT and OT ownership are blurred. In our experience, the best customer implemented solutions for addressing data access, collaboration, and workflow integration challenges required joint efforts between IT and OT groups. While procurement of new software tools has historically been an IT task, we’ve seen significant OT involvement in the evaluation, selection, and ownership of new analytics tools to address this issue.

High-Value Chemical Industry Use Cases
Some use cases can deliver high business value regardless of the organization or industry where they are implemented. The following four use cases were described by between 68 and 95 percent of respondents as valuable to operations.
- Event Monitoring – Batch Runs, Equipment Start-ups, Product Transitions (82%)
- Predictive Maintenance Calculations (77%)
- Production Loss Monitoring by Reason Code (68%)
- Asset Performance Monitoring (95%)
Execution of each of these four use cases requires a toolset with advanced event identification, predictive modeling, and asset scaling capabilities.
The Most Shocking Response
An overwhelming 82 percent of respondents claimed Excel as their primary tool for process data visualization and analysis. In 2020!
At a time when buzzwords like machine learning, artificial intelligence, and digital twins are thrown into casual morning coffee discussions, it can be difficult to understand why process engineers are still touting Excel spreadsheets as their tool of choice for time series data analytics. It seems Excel is like comfort food for industry professionals. It will get you the calories you need to survive (and so many more), but it’s not the best or most efficient way to fuel the body. Spreadsheets were innovative when they were introduced in 1985. In fact, a process data historian didn’t stand a fighting chance in the market if it didn’t come packaged with an Excel add-in.
Excel has continued to rule industrial data analytics as one of the only tools with the capability of querying a variety of databases. Effective analysis of process data requires a 360-degree view of the process, and chemical industry professionals can only get about half of that view from the process historian data alone. Sixty percent of survey respondents are currently analyzing their process data in the context of other data sources, like LIMS, MES, Batch, and Maintenance databases. Despite this statistic, there are still surprisingly few applications out there that provide an inclusive environment where each of these data sources can play happily together with process data historians (we recommend checking out Seeq Cortex).
Another factor keeping SMEs in Excel is the easy linkage between the visualizations and calculations developed in spreadsheets, and the platform they’ve historically used to share those insights. We were surprised to hear that 95 percent of survey respondents are using email for sharing results with their colleagues. The sharing of insights via Excel charts embedded in an email that will eventually get buried in an inbox and thrown out to make room for yet more emails feels very 1995. What we see in companies embracing the digital age in manufacturing is they are turning towards browser-based advanced analytics applications facilitating online collaboration, easy permissions configuration, and sharing.
Machine Learning Myth Busters
Machine learning is becoming the new “Crossfit”. If you aren’t boasting about your machine learning triumphs to all of LinkedIn, are you even doing machine learning?! Actually, you very well could be.
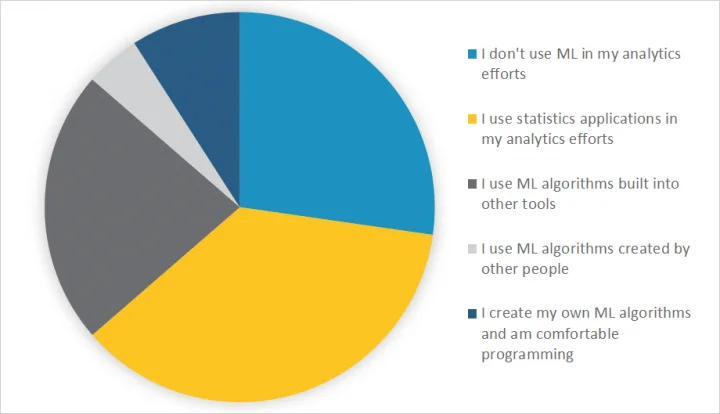
Instead of asking chemical industry professionals if they’re using machine learning, we asked them how they’re using it. Less than 10 percent of respondents reported writing their own machine learning algorithms, while nearly two thirds self-identified as consumers of existing ML algorithms, primarily in the form of other tools. This response was both surprising and encouraging. Machine learning doesn’t have to mean black box algorithms. It can mean models built on first principles understanding, process knowledge, and experience—where advanced statistics and ML software tools are transparent and presented in a low or no code environment, empowering process SMEs.
The chemical industry professionals polled showed great understanding of a broad spectrum of machine learning concepts and high value analytics use cases. Removal of hurdles in areas such as organizational silos, workflow inefficiencies, ease of event identification, model development, KPI reporting, and sharing of insights will propel the chemical sector to the forefront of process data analytics innovation.
Applying Advanced Analytics to Your Chemicals Operation
In a recent Seeq webinar, our experts discussed how to move beyond inefficient and costly data wrangling and contextualization processes by implementing advanced analytics in your chemicals operation.
Make sure to download the on-demand recording today to discover how to maximize productivity by deploying an advanced analytics solution purpose-built to collect, cleanse, contextualize, and perform calculations to pull insights from chemicals data.